The Prime Oscillator+
The Prime Oscillator+ is a powerful technical analysis tool designed to provide traders with a multi-faceted view of market trends and potential price movements. By integrating several key components, each with unique analytical capabilities, the Prime Oscillator offers a robust mechanism for evaluating market conditions, predicting trends, and identifying potential trading opportunities. Below is an outline of each component, how to use it, and how to get the most out of the oscillators in your trading:
 |
|---|
| A full overview of the Prime Oscillator+ |
Our Video Guide
For a video breakdown of all the Prime Oscillator Plus features, watch the video below:
Money Flow Tracker
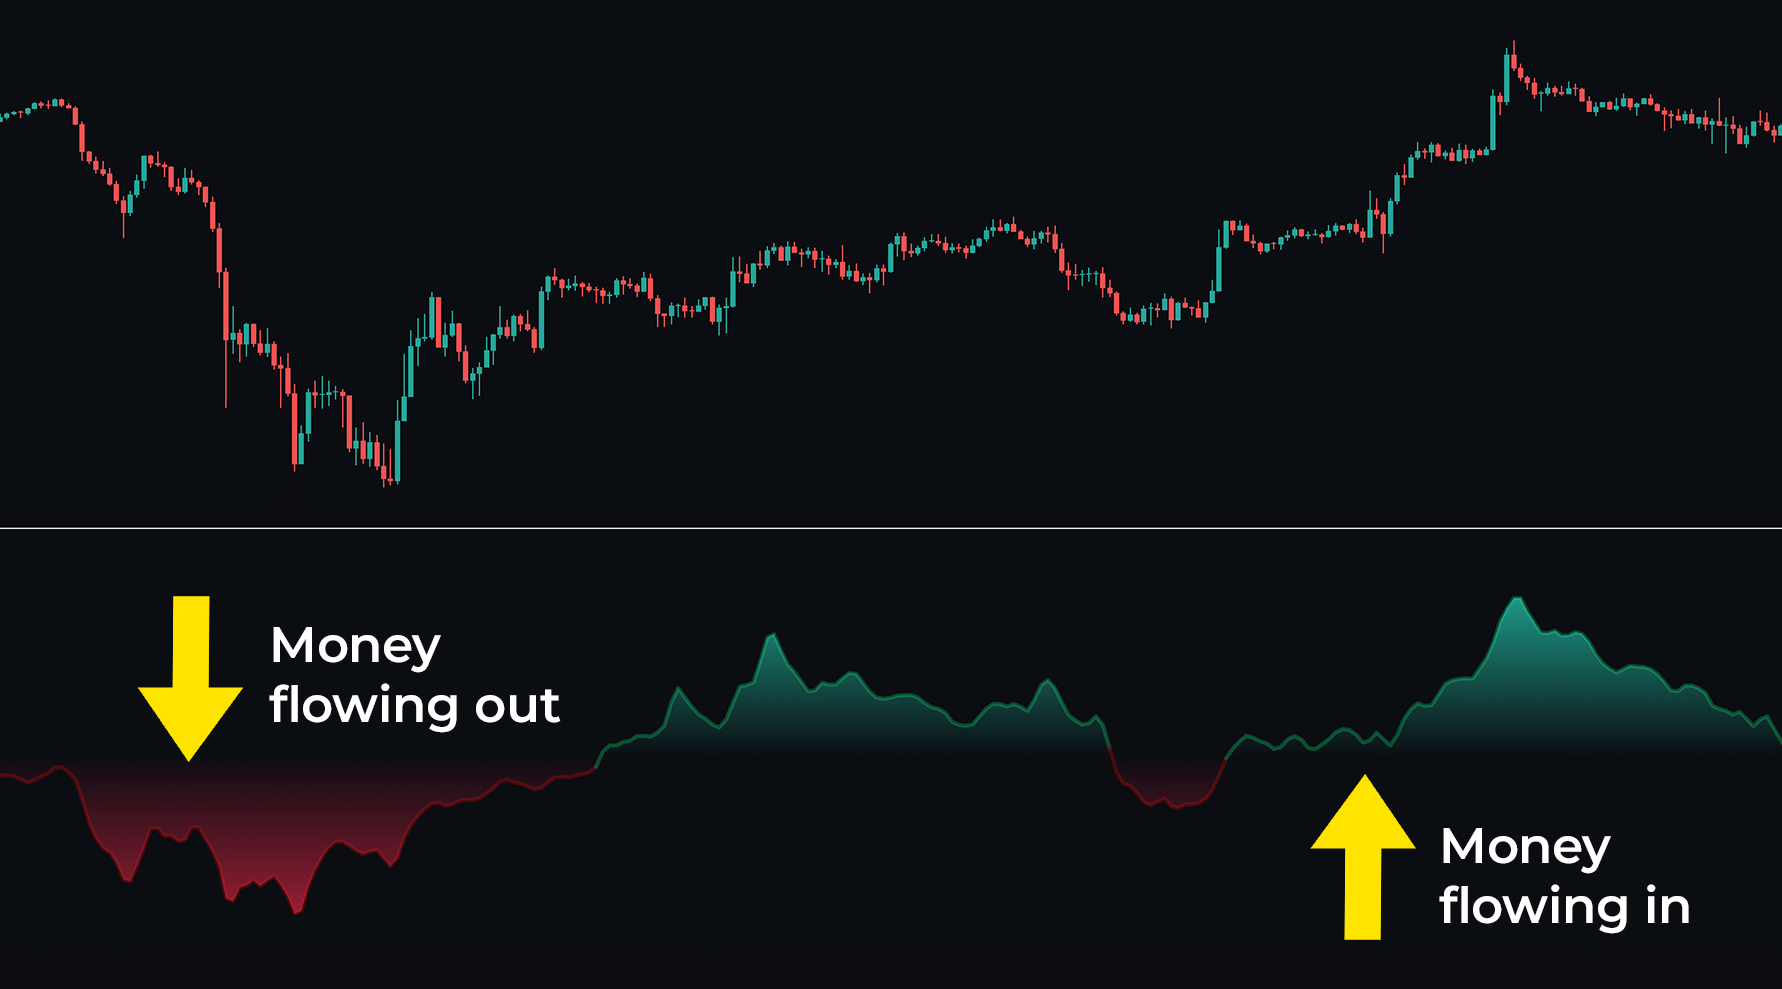
The Money Flow Tracker measures the flow of money into and out of a security over a specific period. By combining price and volume data, it provides insights into the buying and selling pressure of an asset. Utilizing low-lag filtering methods, this confluence of readings theoretically creates a more reliable oscillator. With the MTF, you can understand whether money is flowing into or out of a market. Generally speaking, if the oscillator is green, buyers are entering the market, and we would want to do the same. If the oscillator is red, this means money is flowing out of the market, and hence selling our asset might be wise.
 |
|---|
| Money Flowing in and out of the market |
This feature allows for:
- Early Trend Detection: By highlighting periods of positive (green) and negative (red) volume, traders can anticipate shifts in market sentiment before they are reflected in price action.
Volume Matrix
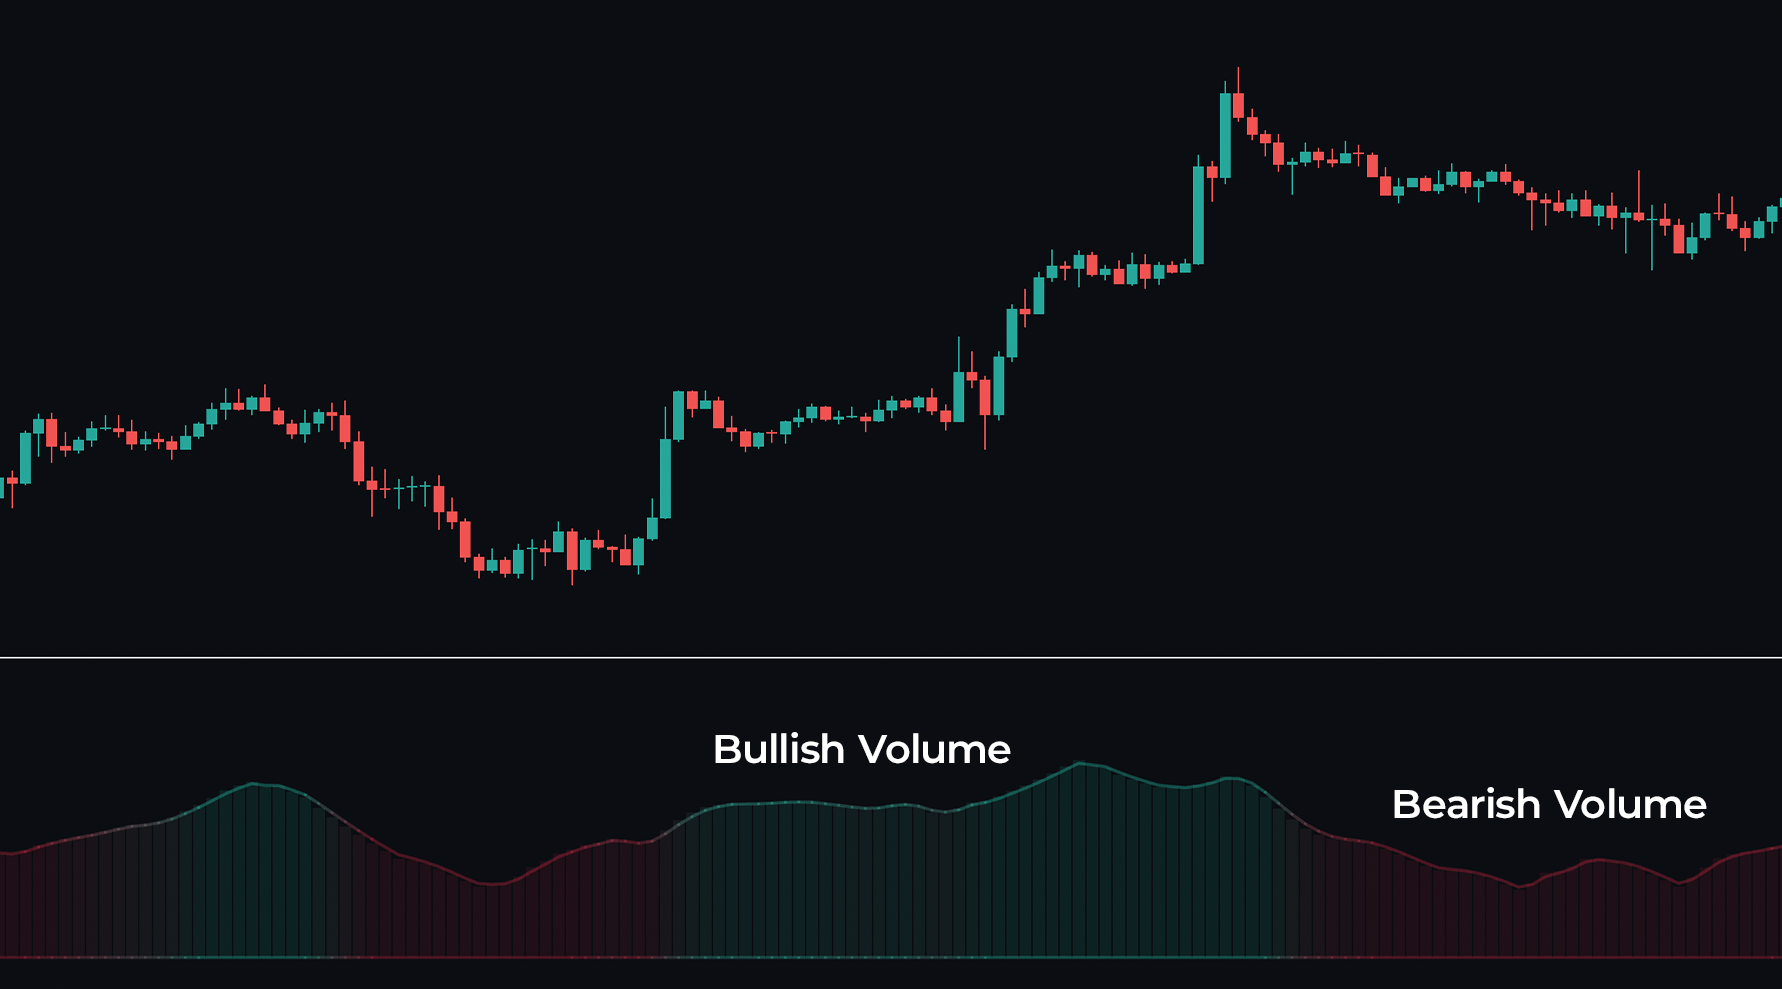
The Volume Matrix is a volume oscillator that shows whether money is flowing into or out of the market. Green suggests an uptrend with buyers in control, while red indicates a majority of sellers. By incorporating smoothed volume analysis, it distinguishes between bullish and bearish volumes, offering an early indication of potential trend reversals.
 |
|---|
| Volume readings on the chart |
By watching the Volume Matrix, traders can build confluence and receive early warnings of trend reversals. For example, if we know sellers are entering a market, this could be an early warning sign.
Top and Bottom Power Bars
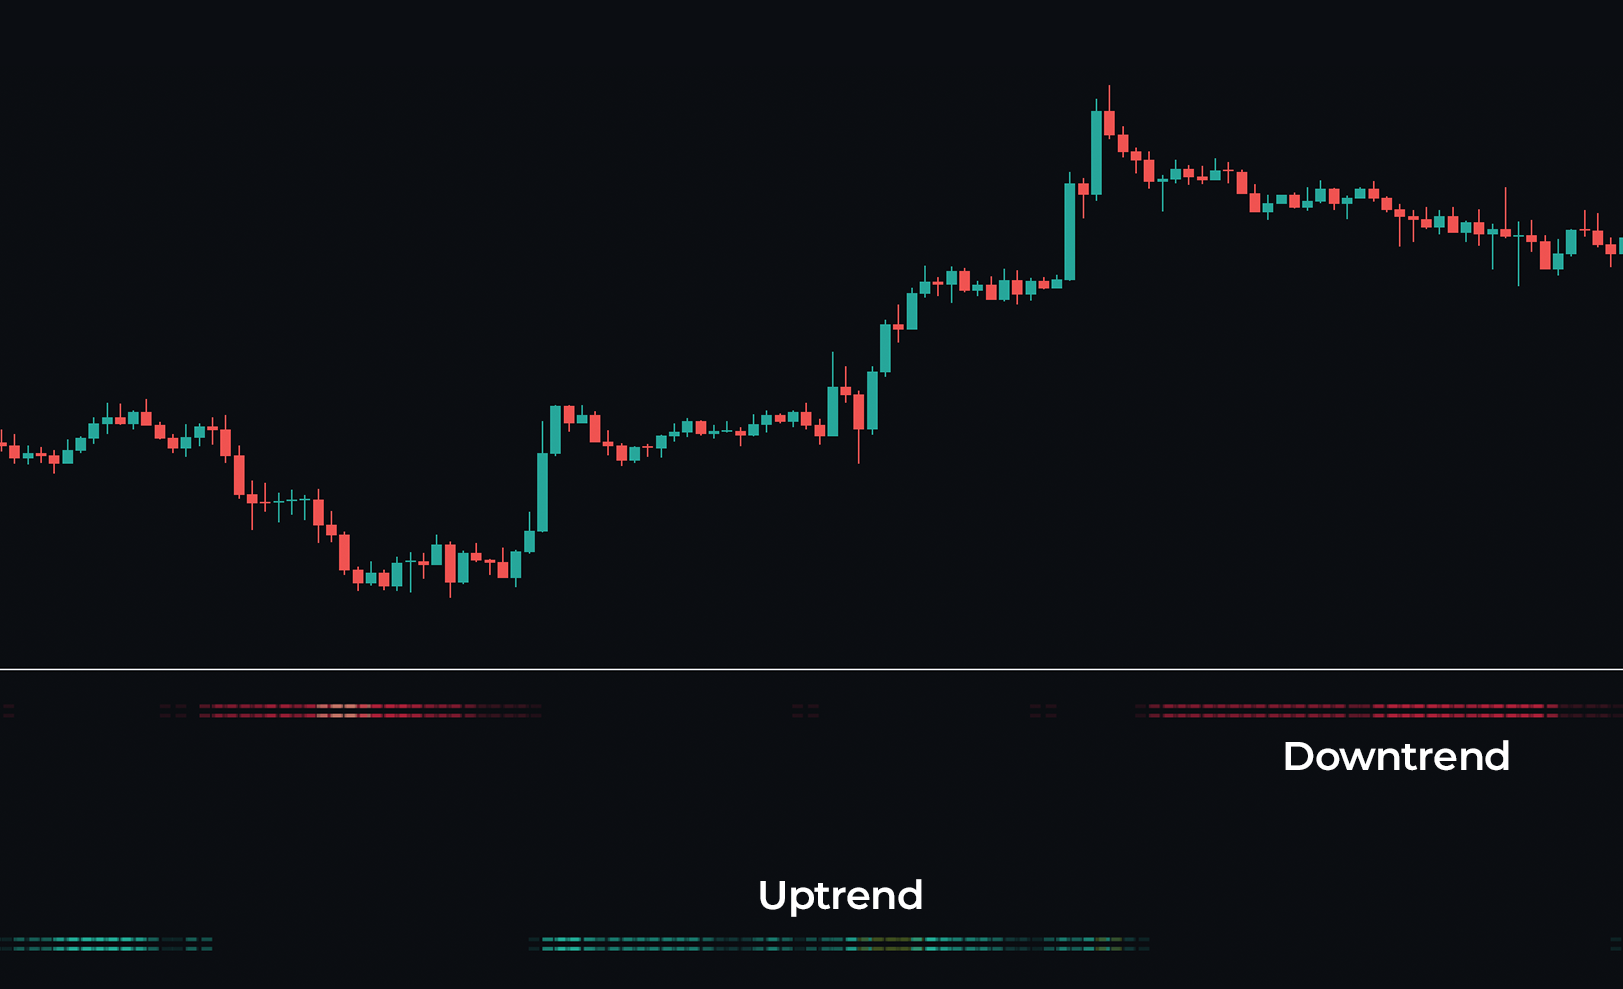
Top and Bottom Power Bars represent confirmation of trends based on the convergence of seven different conditions, with brightness indicating the strength of the trend. Brighter lines suggest strong trends, while dimmer lines indicate weaker trends. These serve as excellent confluence for a trade and provide perfect filtering for other components. For example, if the Power Bars are green and our MTF is green, this is a great indicator that it's a good time to buy.
 |
|---|
| Trend following using power bars |
Key Benefits:
- Trend Strength Identification: By visually representing the strength of a trend, traders can gauge market confidence in a particular direction.
- Overbought/Oversold Conditions: Bright lines in overbought or oversold zones signal potential reversal points, helping traders avoid entering positions at extreme highs or lows.
Volume-Inspired Signals
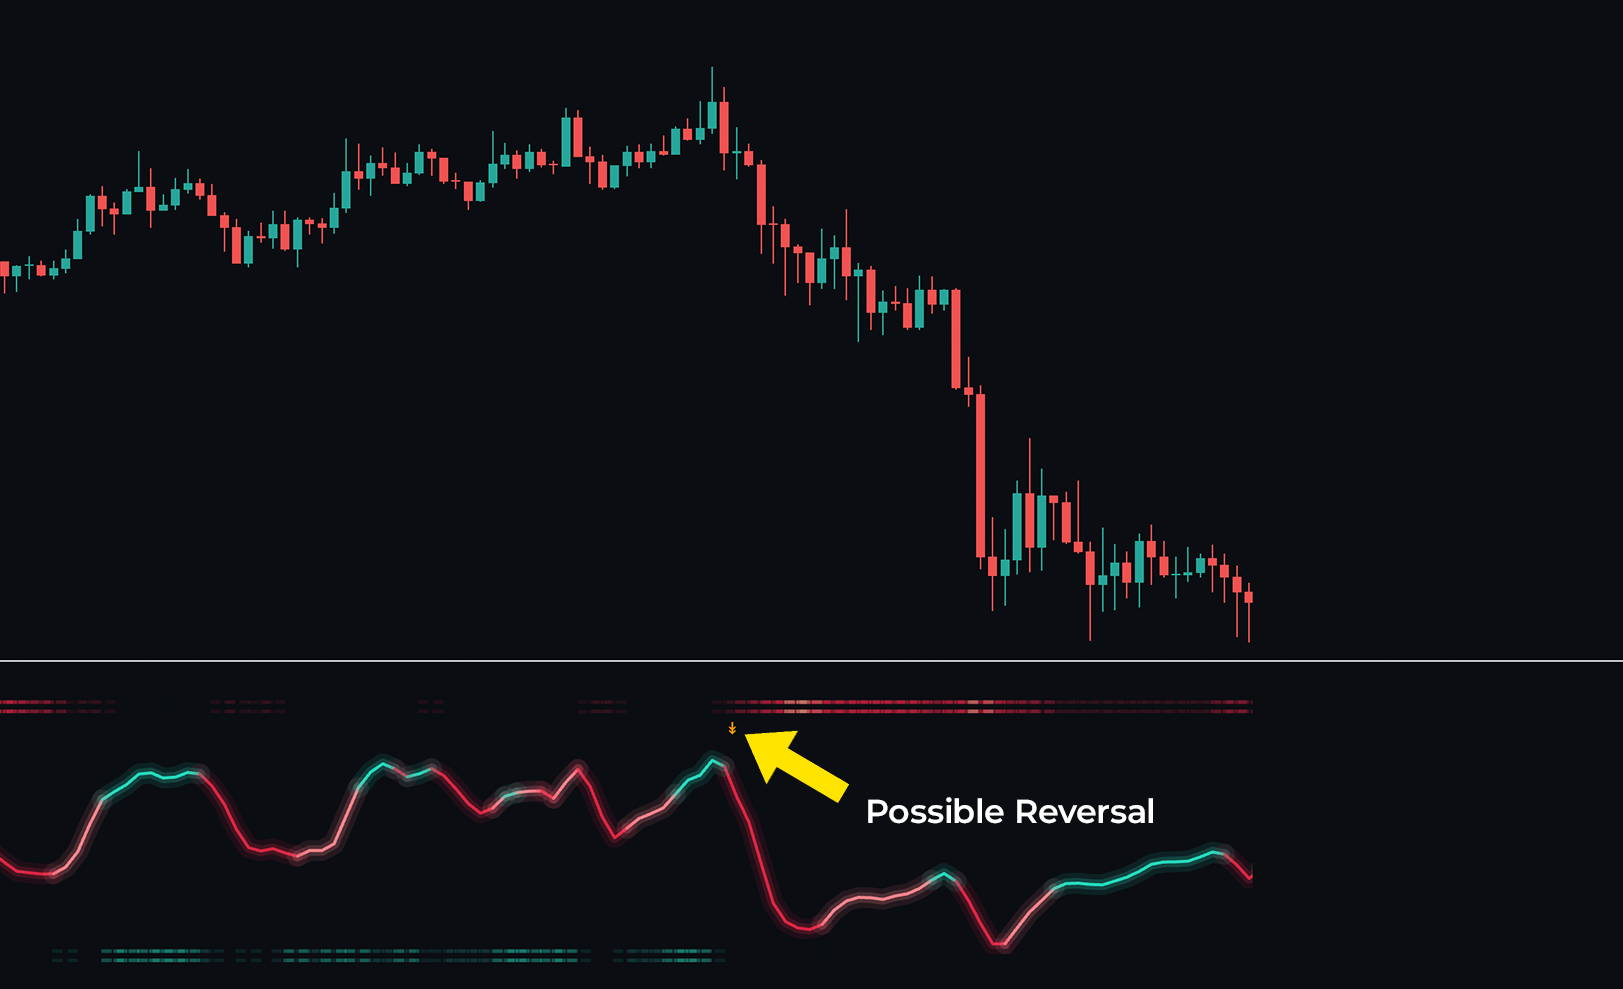
Volume-Inspired Signals determine overbought and oversold conditions, adding another layer of analysis to the oscillator. These appear as orange labels, providing a simple reading into a possible reversal.
 |
|---|
| A signal suggesting a downtrend will begin |
Advantages:
- Price Fairness Assessment: These signals help traders assess whether the current price is above or below the average price, adjusted for volume, indicating potential reversal zones.
- Improved Timing: By using these signals, traders can enhance the timing of their entries and exits, ensuring alignment with broader market consensus.
The True 7
The True 7 is a middle-ranking system that evaluates the strength of a move and the overall trend, offering a numeric or visual representation of trend strength. It can also indicate when a trend is starting to reverse, providing leading signals for potential market shifts. Rather than using an oscillator, this offers the unique edge of falling into set categories, making understanding it simple.
| A score of 7 suggesting the market might reverse |
Notable Features:
- Reversal Signals: These contrarian signals predict market reversals and the oscillator's movements.
- Confluence: This system offers a unique confluence, boiling down market performance to a rank rather than a value, a feature often lacking in other tools.
Peak Seekers
Peak Seekers are blue dots that analyze multiple indicators to more accurately identify divergences. These settings are auto-optimized depending on the user-selected timeframe.
Main Oscillator
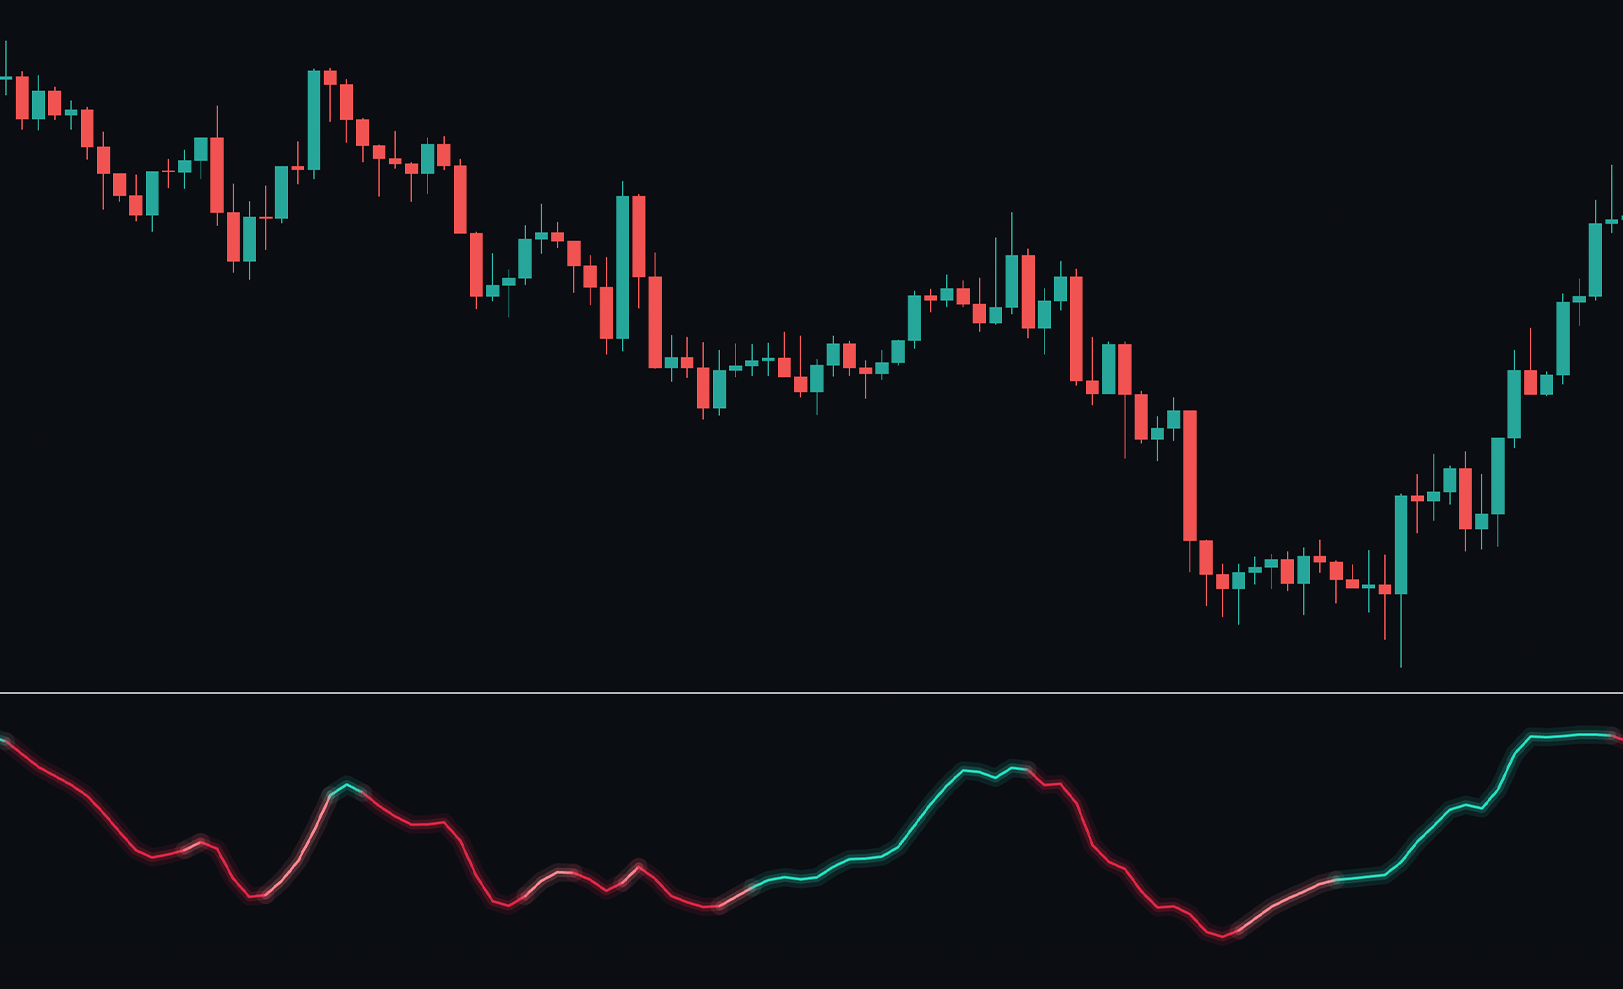
The Main Oscillator is designed as a low-lag identifier of market moves. Using low-lag smoothing techniques, it highlights trends with green and red colors, making it highly effective when used in conjunction with other features in this toolkit.
 |
|---|
| Trend following ribbon |
Key Benefit:
- Trend Strength Quantification: This system quantifies the strength of a trend, helping traders understand market momentum and the potential sustainability of a move.
Automatic Divergences
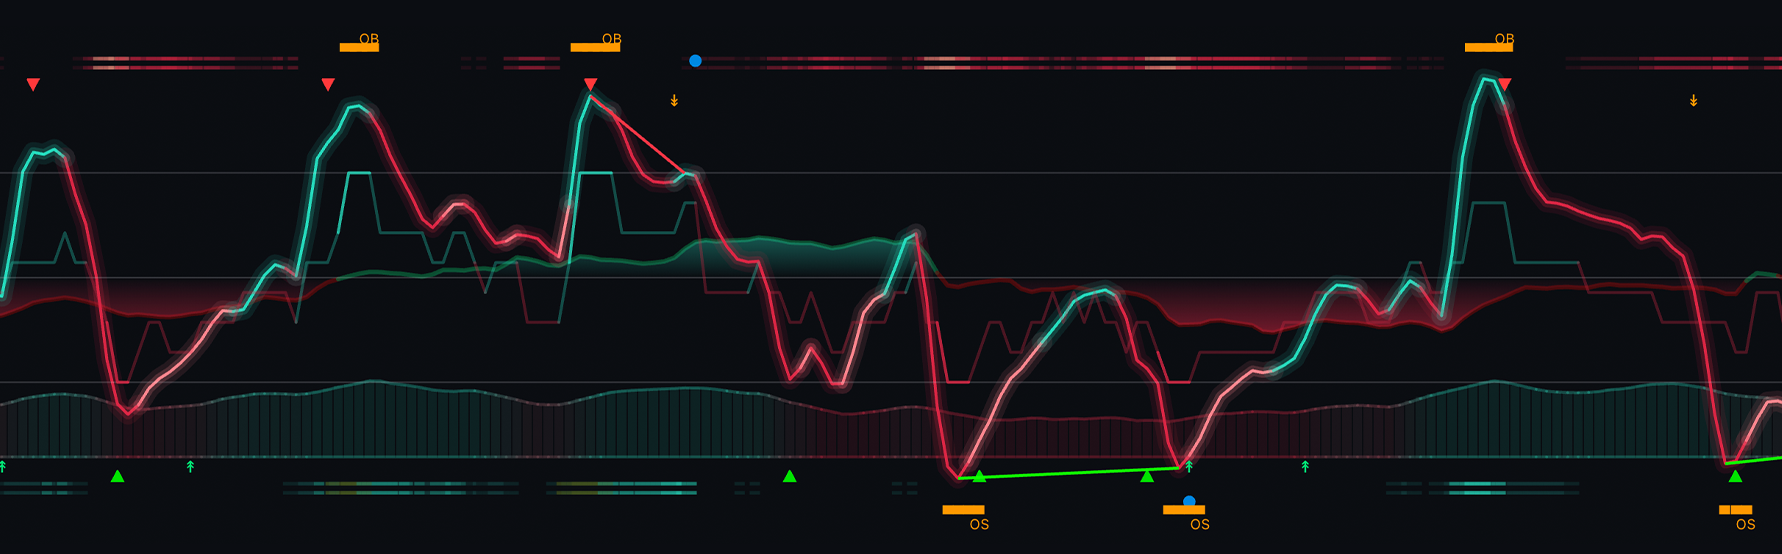
The Prime Oscillator identifies two types of divergences:
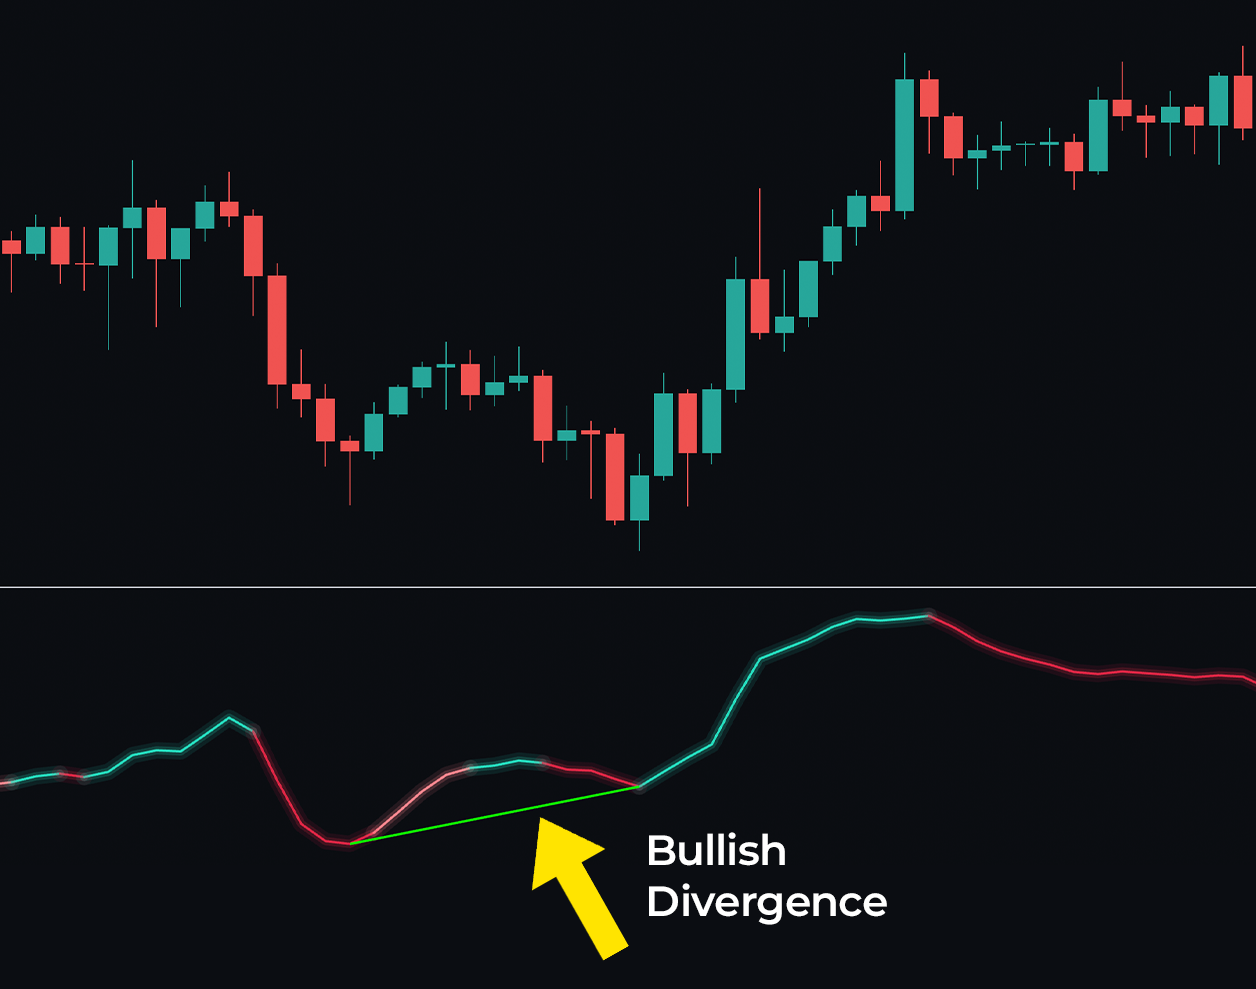
Regular Bullish Divergences: These occur when the price forms lower lows while the oscillator forms higher lows. This pattern indicates that the downward trend is losing strength, signaling a potential upward reversal. Despite the continued decline in price, the oscillator's higher lows suggest that bearish momentum is weakening.
Regular Bearish Divergences: These take place when the price reaches higher highs, but the oscillator registers lower highs. This divergence suggests that the upward trend is losing steam and might reverse into a downtrend. Regular bearish divergences are typically seen as signals to short or exit long positions, as they indicate diminishing bullish strength.
 |
|---|
| Bullish Divergence found |
When the oscillator automatically labels divergences, a green line will connect the troughs during a bullish divergence, indicating a possible upcoming bullish bounce. Conversely, during a bearish divergence, a red line will link the peaks of the oscillator, suggesting a potential market pullback.